;

car dealers

AutoHook Releases All-New Advanced Lead Scoring to Deliver More Sales at a Lower Cost to Dealers

As part of ongoing solution innovation initiatives, Urban Science’s Advanced Analytics team was tasked with the challenge of developing a new, technologically superior, enhanced lead scoring model to apply to AutoHook’s third-party incentive solution, also known as Lead2Show. This new, centralized model has proven to pinpoint even more leads with the highest probability of purchasing, faster and more accurately than ever before.

AutoHook’s new lead scoring model leverages the unrivaled sophistication of the Urban Science® DataHub™ - the only source of near-real-time industry-wide sales* data-fueled directly from automakers, not 90-day old registration data. Daily processing of sales and lead data allows us to deliver superior lead scoring automation technology that identifies more in-market buyers faster, without increasing the number of incentives issued.

For our dealers, this means a more efficient, cost-effective solution that eliminates instances of wasted time and money incentivizing leads with a low likelihood of purchasing or leasing a new vehicle. Simply stated, this advanced lead scoring model allows us to send even higher quality leads with the highest propensity to buy into dealer showrooms.

The direct-to-dealer benefits of our new, advanced lead scoring include:

  1. More Sales

  2. Higher Buy Rates

  3. Lower Cost Per Sale

  4. Less Waste (more buyers without increasing the number of incentives issued)

But we don’t expect you to take our word for it. In true Urban Science fashion, we have the data to prove it. We conducted extensive testing and validation efforts to confirm not only that the technology effectively does what we built it to do, but we also calculated the exact statistical significance of the implemented enhancements compared to our previous scoring model.

Methodology

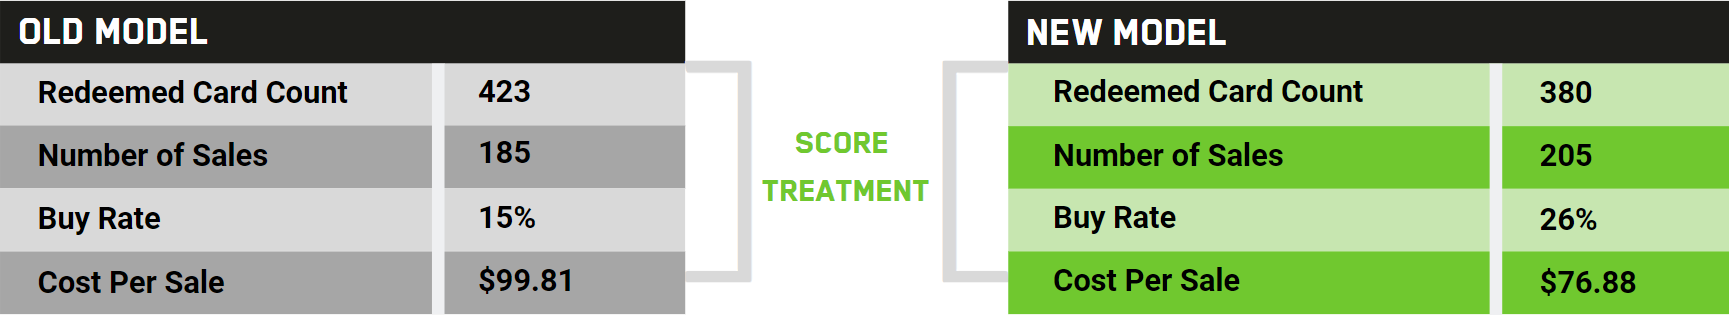
To calculate the success of the upgraded technology, we applied both scoring models to the same data set of 173,532 third-party leads across all OEM brands over a two-week period. The actual results shown below reflect only the leads that were validated to have a high likelihood to purchase and thus received an AutoHook incentive offer. The data confirmed the new and improved algorithm provides significant, quantifiable benefits to our dealers including more sales, a higher buy rate and a lower cost-per-sale.

oldvnew.PNG


Results

  • 73% Higher Buy Rate

  • 23% Reduction in Cost Per Sale

  • 11% Increase in # of Sales

  • 10% Reduction in Incentives Redeemed


Good news for current AutoHook clients, this upgrade in our technology is already working for you and will not affect the cost of our solutions. If you don’t use AutoHook’s third-party incentive solution (Lead2Show), for a $77 cost per sale, why wouldn’t you take advantage of this service?

*Sales refers to vehicle unit sales and does not represent vehicle price or revenue.

What Dealers Don’t Know About Their “Best” Salespeople

by David Metter

As it turns out, what you don’t know about your salespeople can hurt you. I am not sure why, but we don’t often associate analytical tools as the best way to measure the performance of the people we hire to connect with our customers and build lasting relationships. I’m a common sense guy, so if my staff is hitting their numbers and selling cars, there’s really no reason for concern or to take a deeper dive into the opportunities they’re working…right? Not necessarily.

What I’ve come to accept over the last few years is that when good data is presented in a way we can easily understand, it has a tendency to challenge everything we “think” we know about selling cars. Too many of us think that we are the “Presidents of the I Think Club.” I learned that from one of the truly smart guys in the car business, Gary Marcotte, over 10 years ago and I've never forgotten it. 

Dealers have always been able to see their close rates, or how many opportunities each salesperson successfully converted into a vehicle sold. But there is an entire other half (or I could argue 2/3) of the story they haven’t been getting – and that’s how many opportunities they didn’t close and purchased a car from someone else – or in other words, their defection rate. When you layer in data that shows defection rates to competing dealers or brands in your market, it gives life to a story we’ve not only never been able to see before, but one we never even thought to look at before.

I sold cars for seven years, spent years as a sales manager, then the General Manager of a dealership and I eventually became the CMO of large dealer group with 1,100 salespeople to account for. It would have been impossible to analyze every opportunity every person in our organization touched – so the first time I saw this data in action I was blown away.

Take a look at the graph below. The blue line shows how many cars each individual sold during this 3-month time frame. The gray lines show you the number of opportunities that salesperson touched that went on to buy from someone else – whether it was a same make competitor in your market (light gray) or from a competing brand (dark gray).

Performance_bySalesperson.png

In this example, this dealership thought that John was one of their best salespeople. But when you look at your CRM data with a 3-dimensional lens and layer that lost sale (defection) data on top of it, you start to see the true story behind your “all-star” players. You see how many opportunities John touched that went on to purchase from your competitor down the street or from a different brand entirely.

In reality, Jordan is this dealer’s best salesperson. Based on the opportunities he was working, he sold substantially more than he lost. In fact, out of everyone, he lost the least amount of opportunities. So success doesn’t always translate to selling more cars than you did last month. It can also mean losing fewer opportunities to competitors.

Here’s another example. The screen shot below shows the actual effectiveness of a salesperson as they compare to the dealership overall. So in this case, Jim may only be selling 8 cars a month, but because he’s not getting all the opportunities, his effectiveness is 149% - meaning he’s outperforming based on the leads he’s getting. Bill on the other hand might be getting way too many opportunities and he might look like one of your best sales people, but he’s really only about 47% effective towards closing everything he touches.

CloseRateEffectiveness_bysalesperson.png

Your best salespeople are the ones who consistently deliver HIGH close rates and LOW defection rates. But you need that defection data to see who your real winners and losers are. Think about it like this, a pitcher that has a lot of saves, but has equally if not more blown saves, doesn’t really help the team. Or if a starting pitcher has 10 wins but has 14 losses, is he really a great pitcher? If you only looked at saves or wins, you might think so but when you can see everything at once, the story changes. This is the same sort of comparison.

Keep in mind that if a salesperson has a high defection rate, it may not always be their fault. Maybe they’re being assigned far too many leads than any one person is capable of handling. Or the types of leads they’re working come from providers with low overall close rates. There are all these other factors involved. But those are topics for a different day.

If dealers look at their business through this new lens, they will start seeing trends of opportunity and loss that they can’t see by just looking at their own data and what happens within the four walls of their dealership. In order to determine true success or failure you also need to look at the sales effectiveness outside of your dealership.

EXECUTION: Uncovering Big Data's Missing Piece

white_DataEXECUTION_Oct_Blog (3).png
by David Metter

The greatest marketing trends of all time began as insignificant ideas that eventually gained enough momentum to reach a critical tipping point – the point in which uncharted tools and technologies once overlooked by the masses are adopted by the mainstream. When ideas reach their tipping point, an infectious, unstoppable domino effect goes into play. The undiscovered becomes discovered, the unfamiliar becomes familiar, and the unknown becomes universal truth.

Just as the adoption of CRMs exploded in the early 2000’s and mobile marketing reached its tipping point circa 2014-2015, I believe big data has reached its culmination in 2017. I know this because I’ve seen the distinct black and white clarity today’s automotive data has finally been able to give to car dealers. 

For the past several years, dealers have lacked significant visibility into their market regarding:

  • Where and how they’re losing sales
  • Who they’re losing sales to (whether the customer is purchasing the same make or another brand entirely)
  • If sales are lost due to internal or external factors
  • True successes, failures, and trends tied to each salesperson, lead or traffic source, inventory, day of the month, zip code, etc.
  • Close and defection rates for all your leads and lead providers
  • Validation that you are stocking the right inventory and marketing it in the most efficient manner

… the list goes on.

What we know now is that all of the items listed above are finally within reach. It’s also important to note that the problem has never been the data. It’s that dealers have only been able to view sales trends within their own CRM and DMS. How can you possibly improve your sales effectiveness if you’re only comparing it to yourself? The inability to see the sales and defection trends of top competing dealers and brands in your market has been a HUGE roadblock for dealers... until now that is.

Today’s big data landscape has evolved to become 100% executable. We can quickly gain insights from data using a scientific approach that exposes lost sales by source at an aggregate level. By knowing your lost sales opportunities, who you lost them to, and where you lost them, a strategic path towards increasing sales and reducing defection rates naturally comes into view – despite what your market conditions may look like.

We can even take it a step further and look at success and defection trends tied to an individual person within your sales staff. For example, if someone has a high close rate AND a high defection rate, you can break down where these lost opportunities are coming from. You can see that person is being assigned way too many leads and then you can make smarter decisions in terms of how you divide up your employees’ responsibilities. 

When you can see where you’re losing sales across the board, you can then align your conversion goals, the operational training of your staff, and the way you drive traffic and leads into your dealership – so you can have the highest quality lineup of opportunities to close.

The advent of integrating automotive data to make more profitable operational decisions is similar in many ways to when CRM and DMS technologies were first implemented. Using these tools gave you a way to organize and streamline your process to help you sell more cars. The ability to execute smarter sales strategies using data analysis is no longer alchemy. It’s the current reality of this instant gratification world we live in, and it’s the weapon dealers need to be unstoppable.